Introduction
This 100% client side Javascript application is an implementation of the CMa virtual machine as defined by the text Compiler Design: Virtual Machines by Reinhard Wilhelm and Helmut Seidl. I did the best I could, given the information in the text, so there is no guarantee that it is completely correct.
The main goal of this effort was to produce a tool that a student could use to try out some of the ideas, concepts and most importantly the code described in this text. It is by no means an efficient implementation as I favored code simplicity and readability over efficiency. The user interface was designed (or should I say evolved) to help explain what is happening at each step and to provide tools to make it easy to try out different options.
Contents
Quick start
The fastest way to start using this virtual machine is to try it out with one of the sample programs. Using the Load Sample button at the top right of the main page, select the Simple example. This example is not a full C program interpreted for the CMa machine, but rather some quick instructions, including a predefined value set in memory.
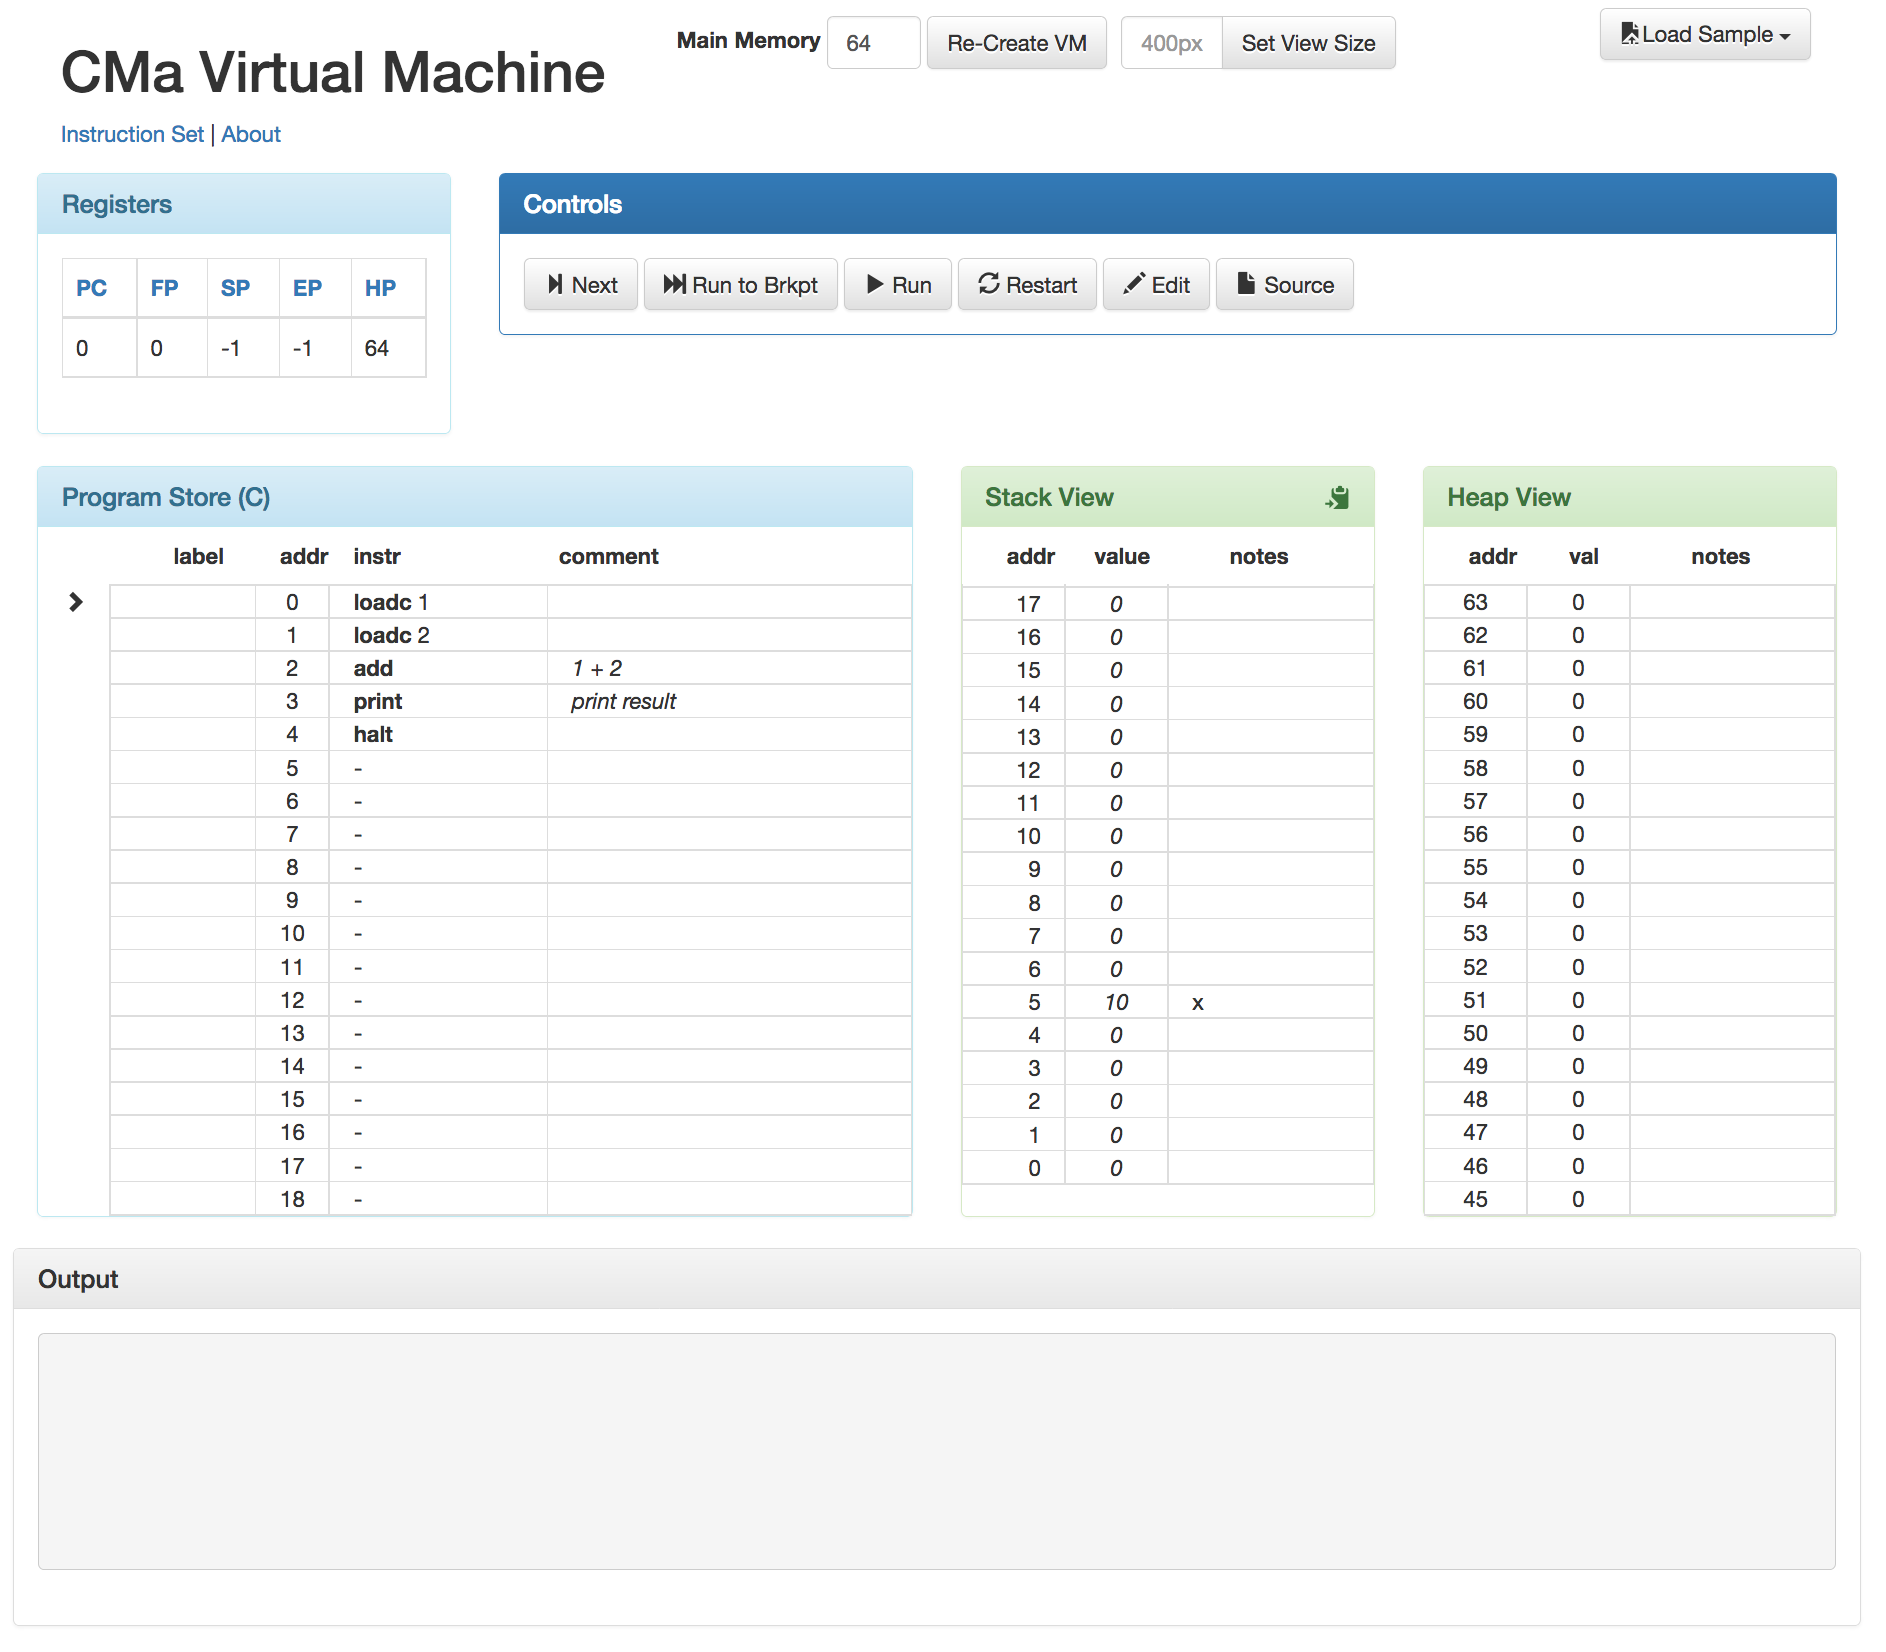
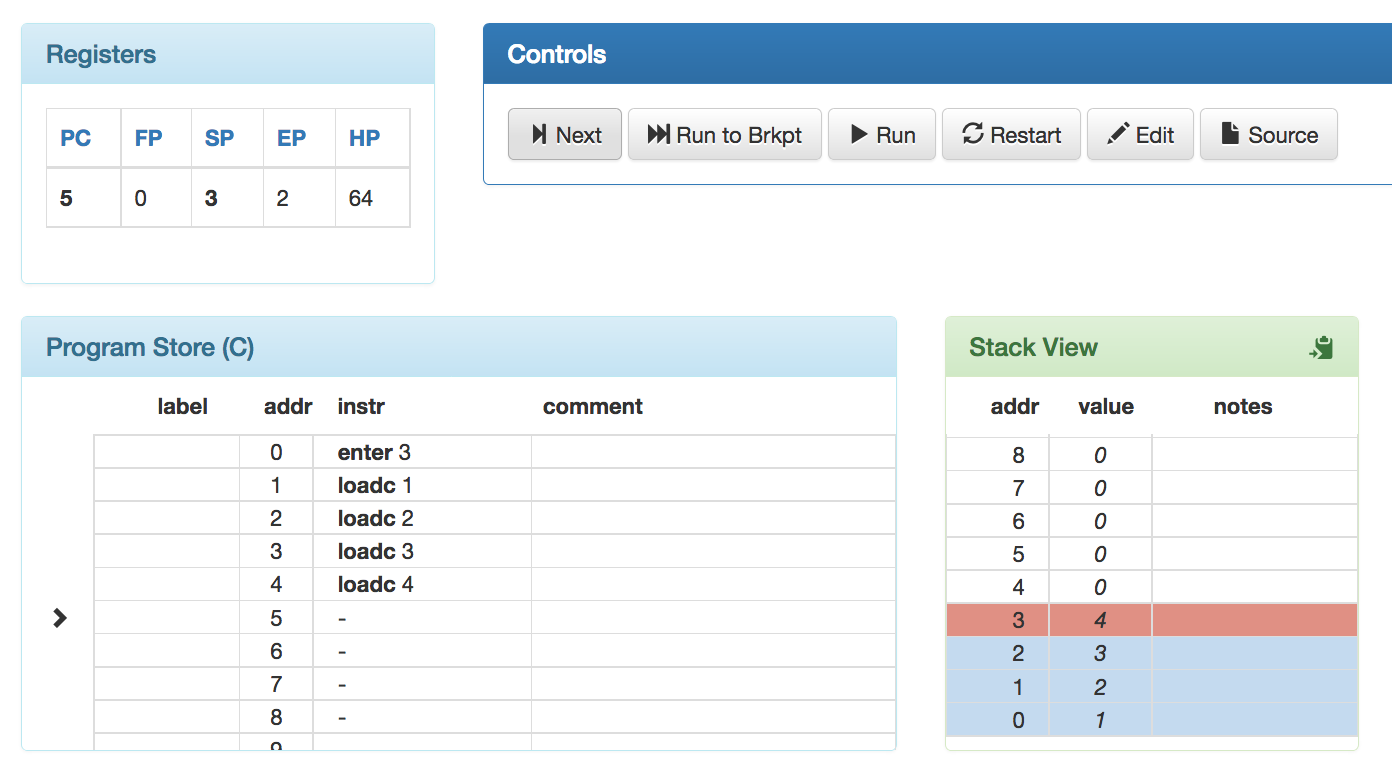
If your screen looks like that in Figure 1. you are almost ready to step through the code. Before you begin you may want to scroll the Stack View such that the bottom of the table is in view (see Figure). For the simple program you will see the memory location 5 has the value 10, with a note 'x'.
Press the Next button in the control panel to execute the first instruction. You'll notice a few changes
in the state of the UI. Each time you press the Next button the program counter register (PC) will increment
by one. Then the instruction will be executed. This first instruction, loadc 1 will put the
constant 1 on top of the stack. You'll also notice that the values on the stack are shaded. This means that
the stack pointer (SP) has been changed to 0, and all values in main memory below the stack pointer are
shaded to indicate that they are active.
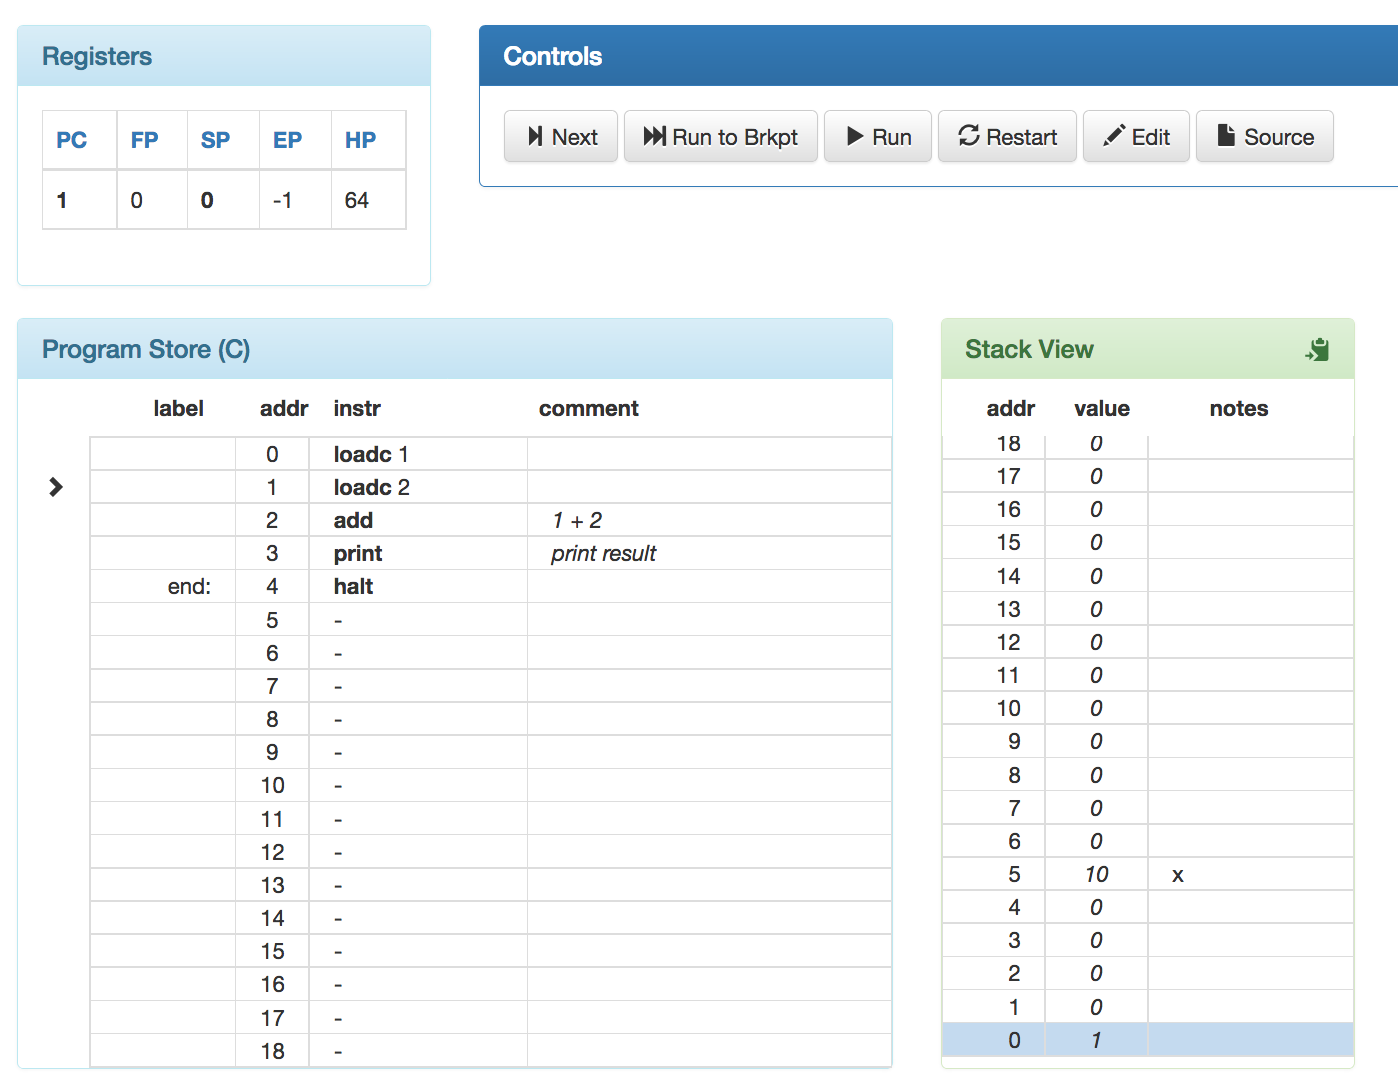
loadc 1The program counter now points to the next instruction. Press the Next button again to load the constant 2 on top of the stack. Again the program counter and stack pointer will increment.
Continue pressing the Next button watching the stack and registers as they change. When you execute the last
instruction; halt the machine will be halted, no further execution can take place. A message is
written in the output. Notice that the last instruction is also identified by the label 'end', which can be
referenced by name in CMa programs.
That's it. That's all she does. Well, the simple program that is. You can press the Reset button to execute the program again, or perhaps try a different sample program. If you want to look a the full, commented source for the program loaded press the Source button. It will open up another tab in the browser and display the program in plain text form with any comments (text after semicolons in any line).
The Screen
At the very top of the screen are two configuration options to set the VM main memory size, and to adjust the viewable size of the Program Store, Stack and Heap Views. We'll examine these later. The upper right hand corner has a button to load the sample code, hopefully you've already used this to load the simple program.
The rest of the page is divided up into panels.
Program Store (C)
The program store is a separate set of memory (distinct from main memory) where the program instructions are stored and walked through. The Program Counter register (PC) points to the next instruction in the program store, which is adorned with a right chevron on the left of the table.
Stack View
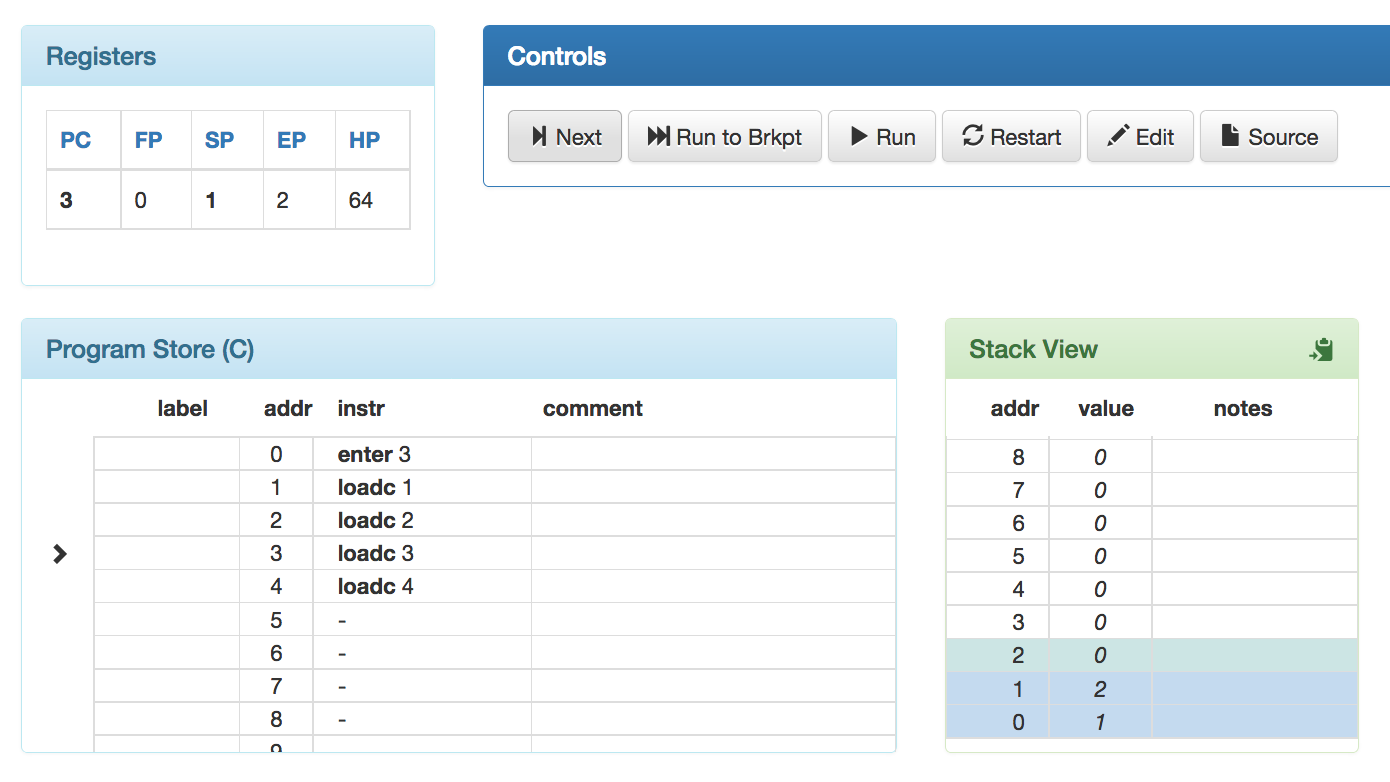
The stack view is one of two views into main memory (the other is the heap view). It appears next to the program store. The highest memory locations appear first in this view, so typically it makes sense to scroll down to the bottom of the view to see the newest activity. The stack view and the heap view show the same main memory, however the rules for shading occupied locations are different. In the stack view everything at the stack pointer and below are shaded a light blue. Everything at or below the Extreme Pointer and up to the location pointed to by the stack pointer is shaded a light green.
If for some reason an item is placed on the stack above the Extreme Pointer the memory location will be shaded red.
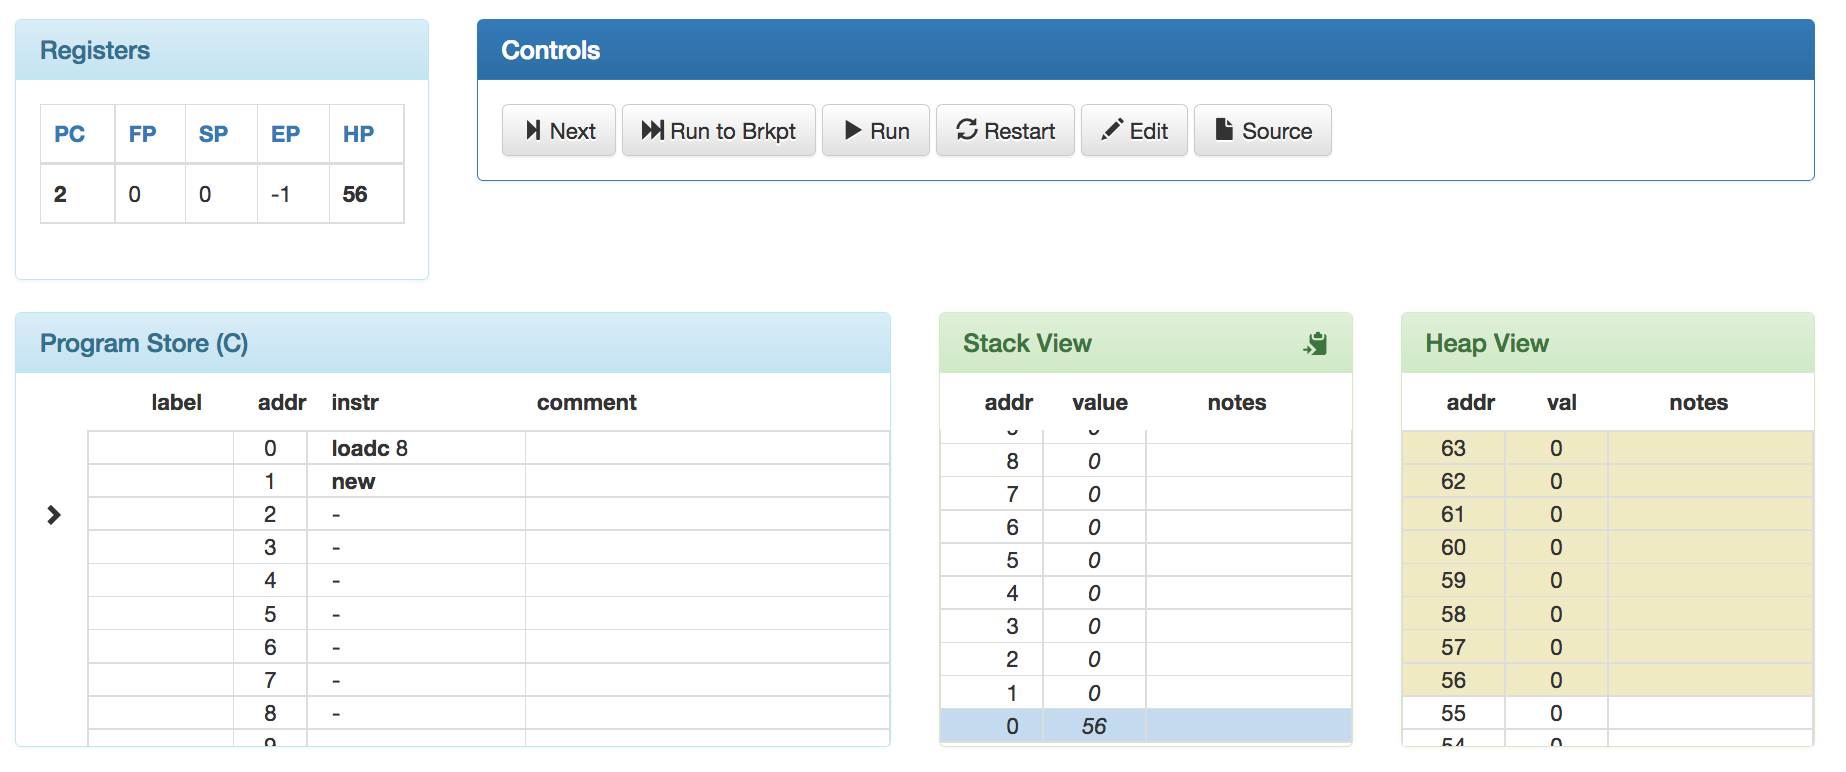
Heap View
The heap view is one of two views into main memory (the other is the stack view). Typically this view begins at the top most memory location and you can scroll down to view the lower memory locations. The shading in this view is a light yellow for all memory locations above the value of the heap pointer (HP).
Registers
The registers panel shows the five built in registers of the virtual machine; the program counter (PC), frame pointer (FP), stack pointer (SP), extreme pointer (EP), and heap pointer (HP). All five of which can be manually changed by clicking on the register name and entering in the new value with the dialog.
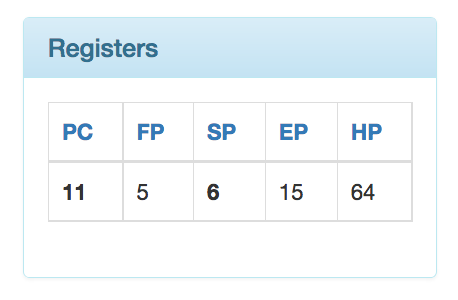
If the virtual machine throws an error while processing an instruction then it will appear as a red panel within the Registers panel.
Controls
The Controls panel includes all the commands you would use to interact with the virtual machine. The
Next button will step past the next instruction (pointed to by the program counter). The Run to Brkpt
button will execute all the statements in the program up to any marked with a breakpoint. If no halt is
at the end of the program an error will be reported (in the area just under the Registers). The Run command
will run the program until it reaches a halt command or an error is thrown during the execution
of an instruction. The Restart command will initialize the registers, and clear main memory, readying the
machine for another run of the program. The Edit command will open up a modal dialog with a simple program
editor and the current program in the edit area. You can edit the program and update the machine for another
execution run (see Editing Programs). The Source command will open another
browser tab and display the current program in plain text with any comments.
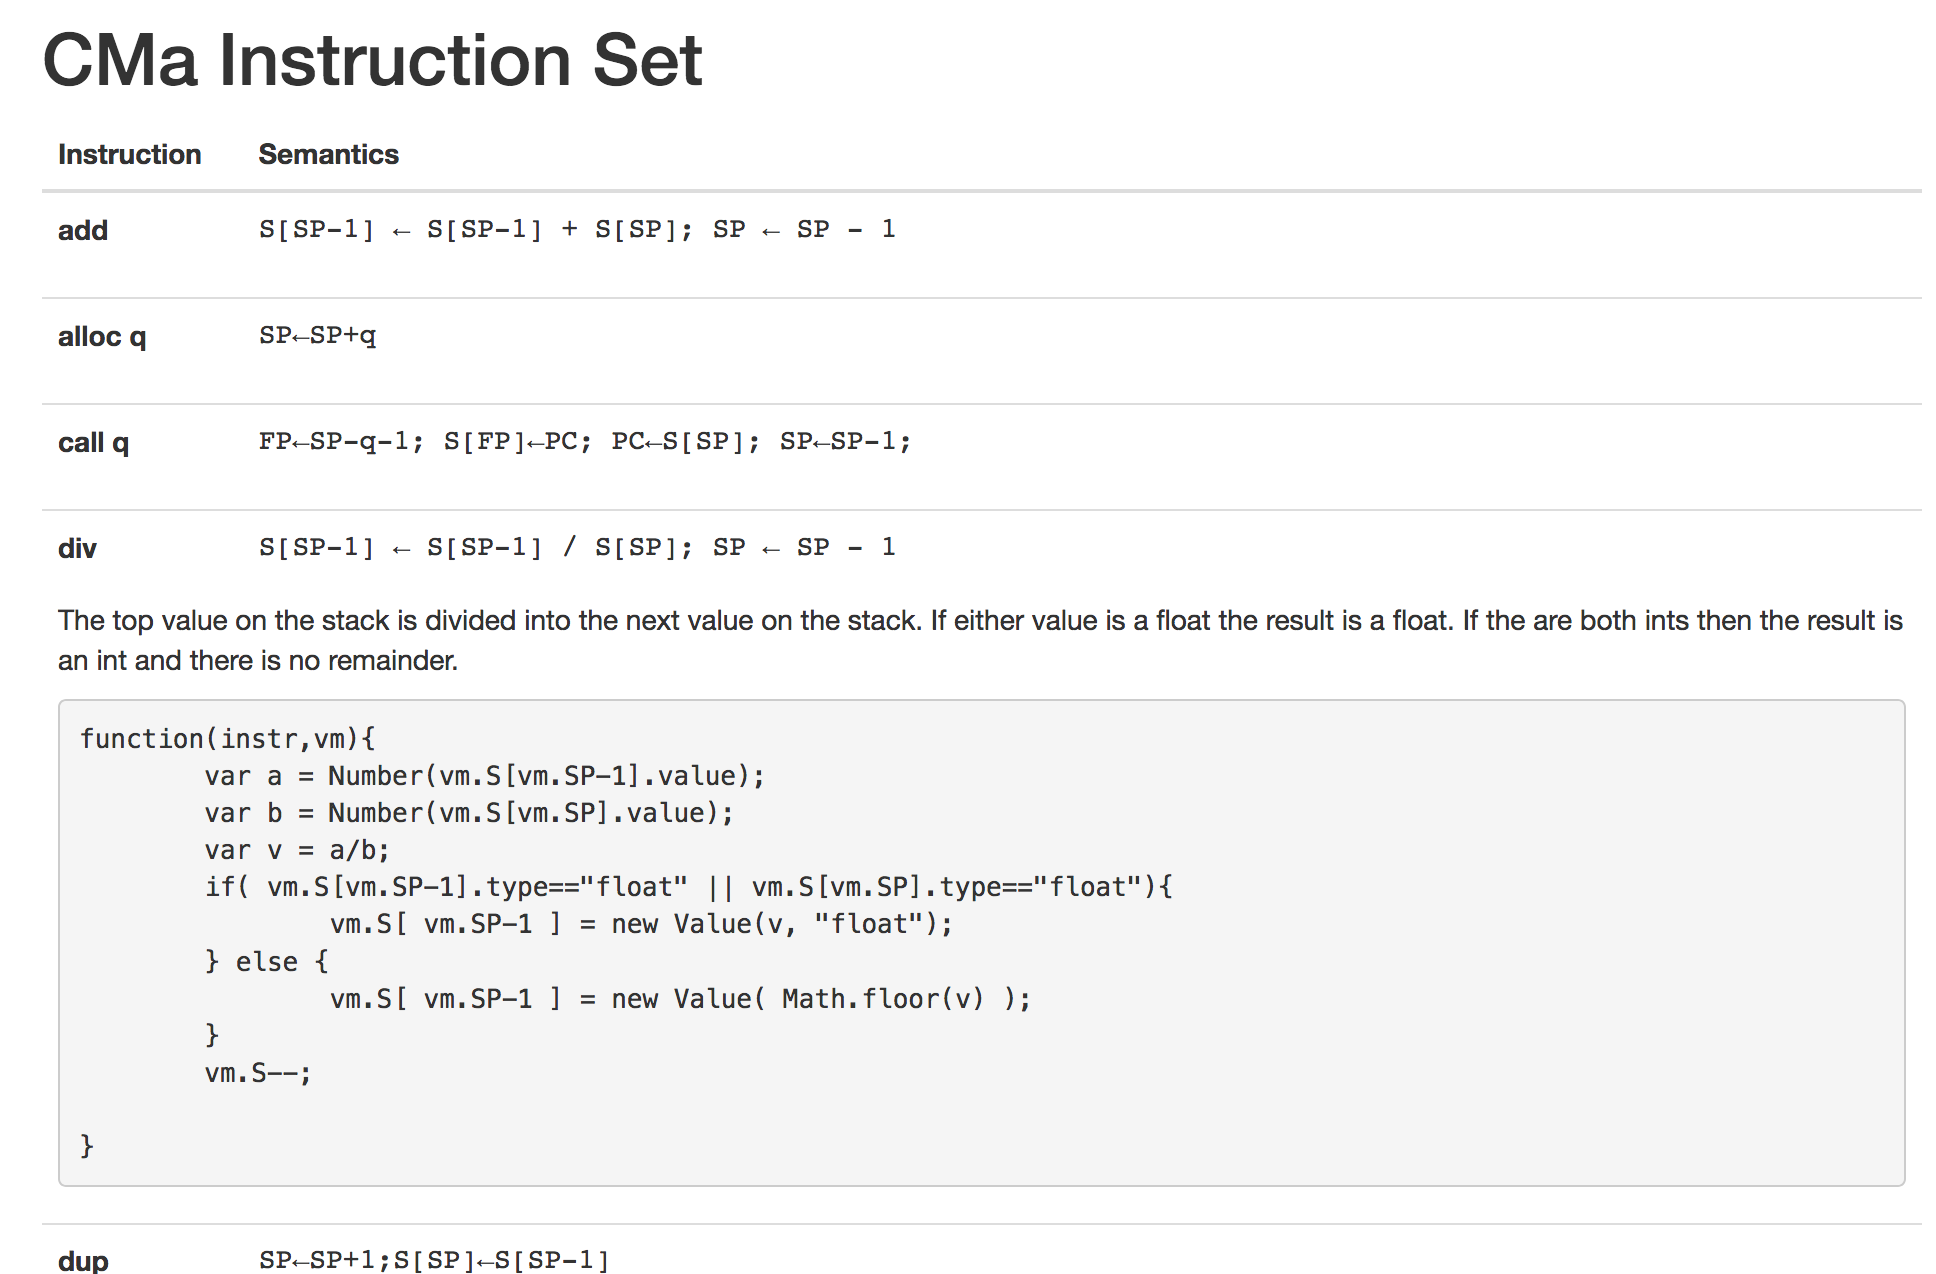
Instruction Help
If you want to know what a specific instruction does in your program, or rather be reminded of what it exactly does you can click on it in the Program Store panel. A modal dialog will appear with the instruction and its semantics (as defined by the text).
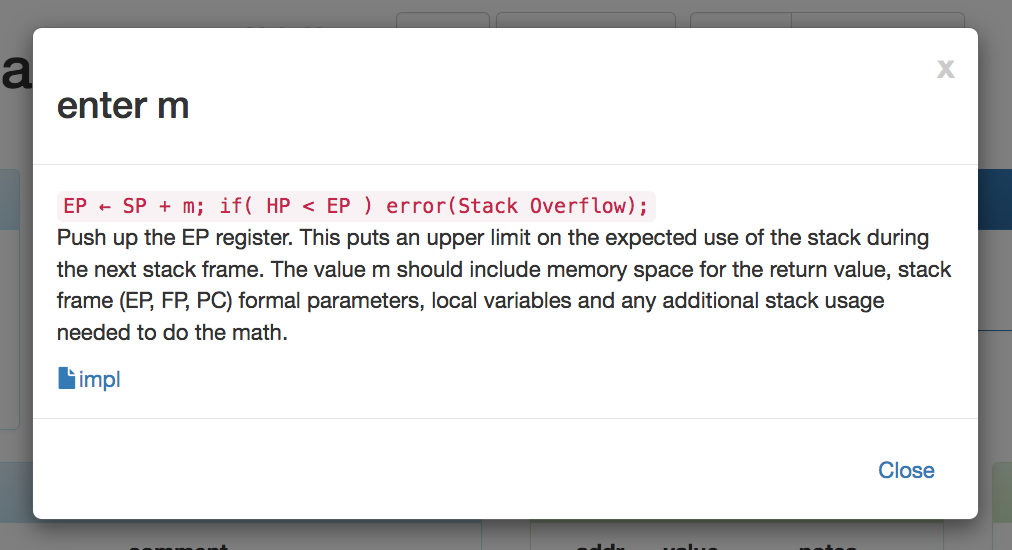
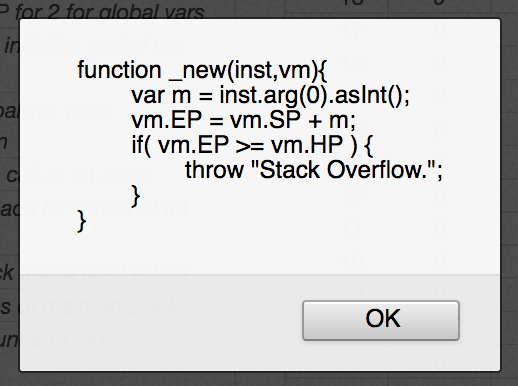
If you click on the impl link at the bottom of the dialog, another dialog will appear with the actual JavaScript implementation of the instruction in it.
If you are interested in all the instructions currently available on the machine you can click on the Instruction Set link at the top left of the main page. This will open up another tab in the browser and display the list of all the instructions (in alphabetical order). Clicking on any of these instructions will expose the full description and JavaScript implementation.